![tharinda.[wiki]](https://tharinda.wiki/wp-content/uploads/2023/05/cropped-lg-1.jpg)
This is a monitoring infrastructure building task with some basic matrices. where the metrics are extracted, processed and visualized using the proposed setup to facilitate data-driven decision making.
Specifically, the following metrics were introduced,
- Core JVM matrices like CPU, Memory, GC and threads…etc
- Monitor any application method execution time
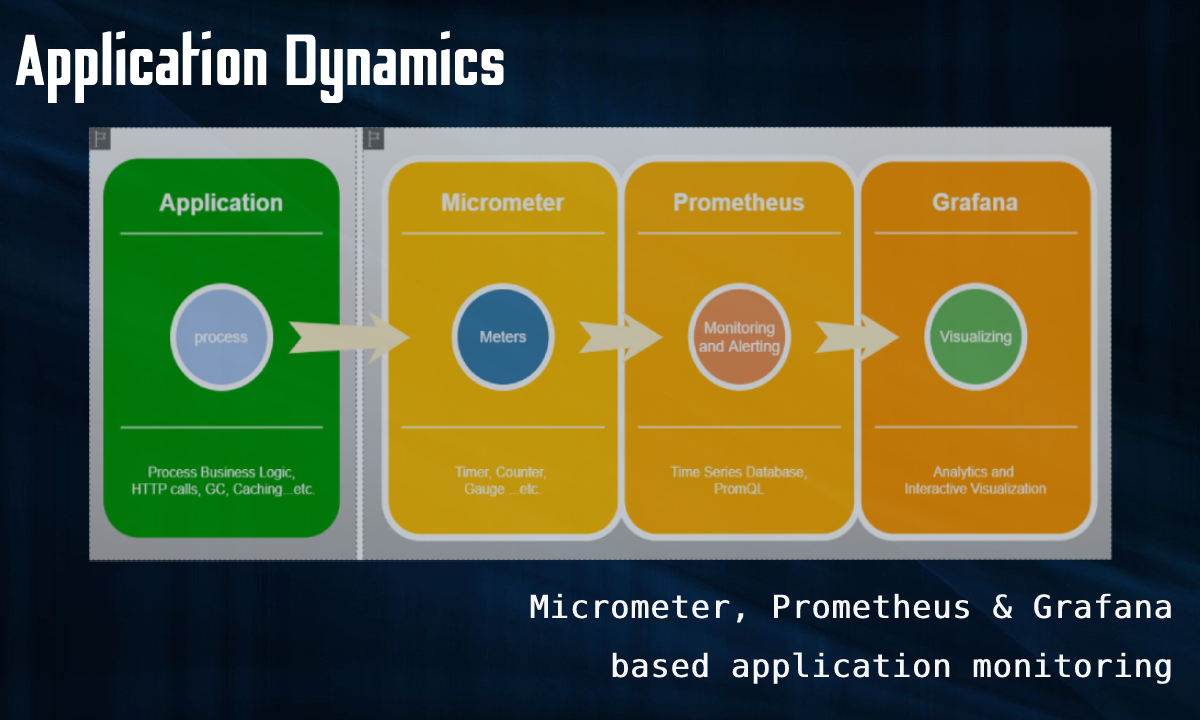
Application Dynamics
Any performance metrics analyzing platform based on following basic steps
- Performance Metric extraction
- Store Metrics ( Time-series database )
- Metrics stat-based visualization and alerting
The following diagram shows the technologies used under this task to achieve the above steps

As mention above proposed system consists of Micrometer as the metrics extraction platform, Prometheus as the monitoring system and Grafana as the visualization platform. The following sections will provide a detailed configuration guide to archive the proposed setup.
Micrometer
Vendor-neutral application metrics facade Micrometer Application Monitoring
Think SLF4J, but for metrics
Micrometer basically provides instrumentation for any JVM-based application without a vendor lock. Micrometer packs with a supported set of Meters like timers, gauges, counters, distribution summaries, and long task timers
Anatomy of a micrometer-prometheus metric
To understand the concepts of performance metrics extraction, the anatomy of a metric needs to be identified first.
Suppose we are to extract “method XYZ execution time“, then Metric usually comes with the following,
- A name ( ex : xyz_execution )
- Multiple tags ( ex : xyz_type=A , xyz_unit=km )
- A value ( ex: 33 )
This kind of Metric will extract from the monitoring system and process to show some information in a useful manner. Micrometer responsible to generate metrics that can digest by the monitoring system. In this case, the micrometer should generate metrics that are digestible to prometheus.
| # HELP hub_task_seconds | |
| # TYPE hub_task_seconds summary | |
| hub_task_seconds_count{ applicationInstance="25005",applicationName="Hub",num_executions="0", | |
| productGroup="integration",productName="Hub",servicedEnvironment="dev",type="OrderAssignedToLager",action="SyncBack" } 1.0 | |
| hub_task_seconds_sum { | |
| applicationInstance="25005", | |
| applicationName="Hub", | |
| num_executions="0", | |
| productGroup="integration", | |
| productName="Hub", | |
| servicedEnvironment="dev", | |
| type="X" | |
| action="SyncBack" } 1.786964501 |
Micrometer Setup
Dependencies
Micrometer provides a set of dependencies to facilitate requirements based on application development framework, monitoring system…etc. When it comes to the proposed setup, the prometheus library has been used as the micrometer registry library, Other than that spring boot actuator library was added to complete the proposed setup.
| dependencies { | |
| implementation( | |
| "io.micrometer:micrometer-core:${micrometerVersion}", | |
| "io.micrometer:micrometer-registry-prometheus:${micrometerVersion}", | |
| "org.springframework.boot:spring-boot-starter-actuator:${spring_boot_version}" | |
| ) | |
| } |
Spring Configurations
At the spring configuration level, MeterRegistry can be configured with some common tags. Then all these common tags will appear in each and every metric.
YAML configuration
The following config snippet shows the application configurations that are related to metrics setup
management.endpoints.web.exposure.includeallows the application to expose themetricsandprometheusspring-actuator endpoints,management.metrics.tags.allows to configure application common tagsmanagement.metrics.enable.allows to control some core metrics such as JDBC , JVM…etc.
| spring: | |
| application: | |
| name: Sync-Hub | |
| management: | |
| endpoints: | |
| web: | |
| exposure: | |
| include: health,status,info,metrics,prometheus | |
| metrics: | |
| tags: | |
| application: ${spring.application.name} | |
| productGroup: integration | |
| productName: Hub | |
| servicedEnvironment: dev | |
| enable: | |
| tomcat: true | |
| hikaricp: true | |
| jvm: true | |
| jvm.memory: true | |
| jvm.gc.pause: true | |
| jdbc: true |
Metrics Extraction
Micrometer provides multiple ways of extracting metrics, The following example shows how the timers are used to extract command execution time. There are two ways of extracting time,
@Timedannotation based extraction- time metric can be extracted as “count/sum” or histogram with percentiles
- this example shows
@Timedannotation used as a histogram with 50th, 90th and 95th percentiles
MeterRegistrybased extraction- this provides a flexible and customizable way of extracting time metrics
- Extra three tags populated using type, action and number of execution
| private final MeterRegistry meterRegistry; | |
| @Timed( | |
| value = "hub.task.histo", | |
| histogram = true, | |
| percentiles = {0.5, 0.90, 0.95}, | |
| extraTags = { | |
| "type", "all", | |
| "action", "all" | |
| } | |
| ) | |
| public TaskExecution execute(Task task) { | |
| task.setUuid(UUID.randomUUID()); | |
| TaskEntity domain = mapper.mapToDomain(task); | |
| return meterRegistry.timer("hub.task", | |
| "type", api.getType(), | |
| "action", api.getAction(), | |
| "num_executions", String.valueOf(domain.getNumExecutions())) | |
| .record(() -> execute(task, domain.asRunning())); | |
| } | |
| private TaskExecution execute(Task api, TaskEntity domain) { | |
| //Make your BL magic here | |
| } |
Prometheus
Prometheus is an open-source monitoring solution used to understand insights from metrics data and send necessary alerts. It stores all the data as streams of timestamped values.
As described in the above section micrometer configured with the dependency micrometer-registry-prometheus which will expose application metrics through /actuator/prometheus endpoint as shown below. All the configured metrics values, tags…etc will be exposed via this endpoint as the prometheus expected format.

| # HELP hub_task_seconds | |
| # TYPE hub_task_seconds summary | |
| hub_task_seconds_count{ applicationInstance="25005",applicationName="Hub",num_executions="0", | |
| productGroup="integration",productName="Hub",servicedEnvironment="dev",type="OrderAssignedToLager",action="SyncBack" } 1.0 | |
| hub_task_seconds_sum { | |
| applicationInstance="25005", | |
| applicationName="Hub", | |
| num_executions="0", | |
| productGroup="integration", | |
| productName="Hub", | |
| servicedEnvironment="dev", | |
| type="X" | |
| action="SyncBack" } 1.786964501 |
Prometheus Setup
In a Spring Boot application, a Prometheus actuator endpoint is autoconfigured in the presence of the “Spring Boot Actuator” and “Micrometer Prometheus registry” dependencies as explained above. This endpoint will be scrape periodically ( scrape_interval ) by prometheus according to the following configurations
  # How frequently to scrape targets by default.
  [ scrape_interval: <duration> | default = 1m ]

  # How long until a scrape request times out.
[ scrape_timeout: <duration> | default = 10s ]| scrape_configs: | |
| - job_name: Hub | |
| honor_timestamps: true | |
| scrape_interval: 5s | |
| scrape_timeout: 5s | |
| metrics_path: actuator/prometheus | |
| scheme: http | |
| static_configs: | |
| - targets: | |
| - localhost:25005 |
Prometheus query language and expression browser
All these scaped data will be stored in a time-series database and Prometheus query language ( PromQL ) will be used to query these data. Prometheus will provide a simple graphical user interface ( expression browser ) where users can play around with data before going into a proper visualization platform.
The following example shows a PromQL code segment that used to graph the average of task execution time
rate(hub_task_seconds_sum{num_executions="0"}[30s])/rate(hub_task_seconds_count{num_executions="0"}[30s])
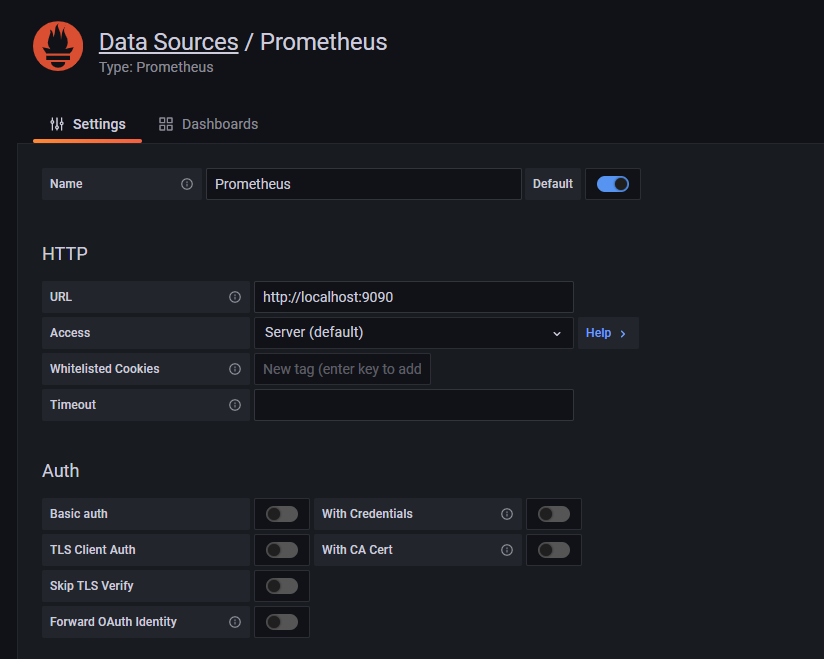
Grafana
Grafana is a multi-platform open source analytics and interactive visualization web application. It provides charts, graphs, and alerts for the web when connected to supported data sources.
Grafana ships with support for Prometheus as a data source and it can be configured as follows,
Grafana dashboards
Then all the data stored in Prometheus can be queried using PromQL and the platform provide a set of sophisticated visualizing tools that can be used to setup meaningful dashboards. This is very useful when it comes to data-driven decision making in any domain.
There is an official and community-driven dashboard store available where we can use preconfigured dashboards.
Link: https://grafana.com/grafana/dashboards
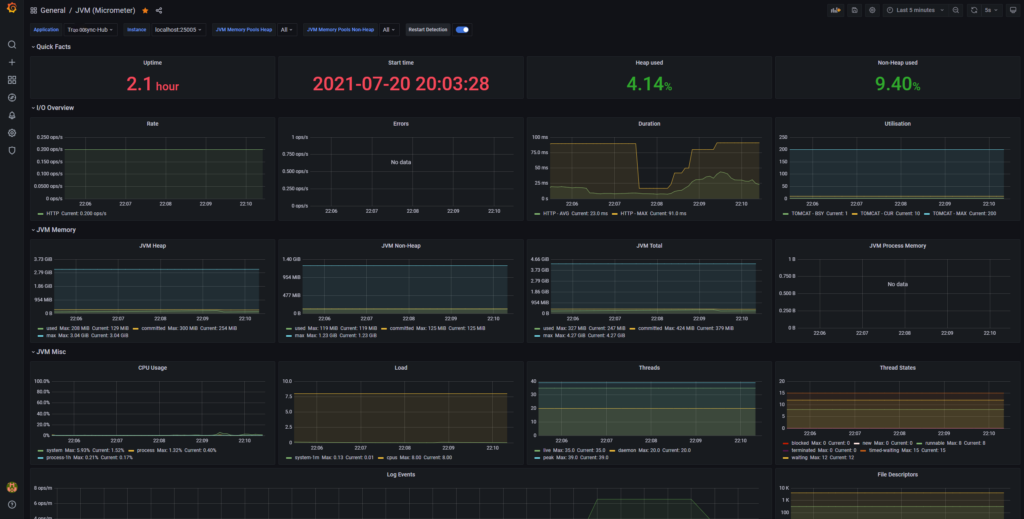
Core JVM metrics dashboard ( Micrometer )
Since this article is based on JVM based example the following dashboard is used to create to visualize core JVM metrics.
Link: https://grafana.com/grafana/dashboards/4701
Customized Task Dashboard
According to the configured command metrics, the following dashboard was created with the following pannels. All the PromQLs that used to populate these panels are mention below
- Command Max Response time ( Command Type Multiline )
hub_task_seconds_max{num_executions="0"}- Command average response time ( Command Type Multiline )
rate(hub_task_seconds_sum{num_executions="0"}[30s])/rate(hub_task_seconds_count{num_executions="0"}[30s])- Command 50th, 90th and 95th percentiles histogram
hub_task_histogram_seconds- Request per minute where type is X
increase(hub_task_seconds_count{type="X" , num_executions="0"}[1m])
- Request per minute where type is Y
increase(hub_task_seconds_count{type="Y" , num_executions="0"}[1m])